As July 1st arrives, our daily relationship to politics becomes more intense. Campaigns, promises, debates, and conversations
about the future surround the dinner tables of a lot of families while others put a lot of effort into avoiding this
kind of discussions. The fear of confronting others who don’t share our political views is also present. For better
or worse, the election makes itself present, whether we like it or not.
A fundamental aspect of elections is that results are not known until voting takes place. Meanwhile, as we approach
election day, the uncertainty surrounding the results makes itself manifest in questions such as: What will happen
in July 1st? Who’s going to win? How will votes be distributed? Who supports which candidate? In one way or another,
we all try to infer the possible answers to those questions. With more or less information, we formulate predictions
and share them during parties, at work, in group chats or social networks.
Two of the main sources of information that feed predictions are polls and trends analysis.
Data that emerges from these two tools varies a lot in terms of methodological and statistical sophistication and aims
to portray the overall situation of opinion and preferences in the country. These studies and their results are published
in newspapers, social networks, and shared in traditional media outlets.
In the coming pages, I will share some thoughts on these two different ways of getting to know public opinion and preferences,
as well as their importance in the electoral process.
Polls
Traditional polls that ask preestablished questions (and are massively applied) have been part of the political agenda
for decades. Ever since Gallup’s predictions about Roosevelt’s triumph in 1936, polls have played an essential role
when it comes to electoral preferences and elections.
Nonetheless, there’s a contradiction within these polls: people don’t believe in them or think that they’re biased,
constantly mistaken or that they benefit only certain candidates. However, a big number of people (including their
critics) use them as reference: they quote them and elaborate their arguments around their data.
I’ll discuss some advantages and disadvantages, by no means all of them, but the ones that I believe are the most interesting.
Pros:
With a well-designed sample, polls can be representative about what Mexicans think of certain subjects, in this case general
elections.
With a well-designed sample, polls can be representative (of the whole population) and can give us ideas about
what Mexicans think of certain subjects, in this case general elections.
They can collect specific information such as political stances, or opinion on a particular subject.
They can reflect changes in the electoral preferences affected by important events. Though this can be a disadvantage
if the polls are not contextualized by temporality.
Cons:
Polls are a social interaction that influences our behavior and our answers to specific questions.
Affability bias: in other words, people that participate in these polls want to seem intelligent, informed and
reasonable. How can we see this phenomenon in the real world? Interviewees don’t want to be ignorant: How will
I admit to a stranger that I don’t know what an educational reform is? Or that I don’t know who a certain candidate
is? Or if I am not sure if I am going to vote because I do not have an ID? We try to make a good impression on
the interviewers. We can change our answers depending on who is asking us the questions. This is more likely
to happen during face-to-face interviews, although it also happens I those done via telephone
Indecisiveness and no-answers: What happens when a big proportion of voters still do not know, or have not decided, who are
they going to vote for? What should we do with this data? What can an interviewer do when the interviewee does
not answer? Many techniques have been developed in order to try and control for these situations, or to figure
out ways to better handle this data. However, when indecision and lack of responses represents a big proportion
of the data, the results reflected can change, and tendencies that seemed very clear can be reverted
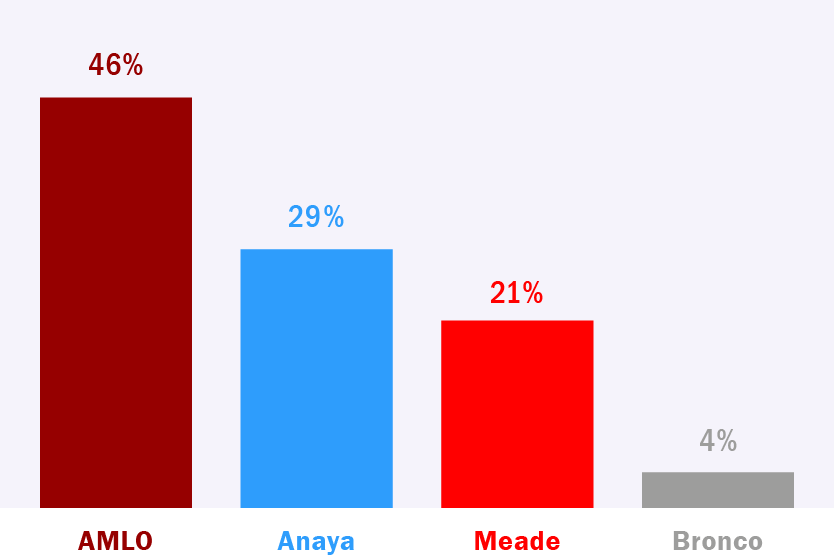
These next two graphics represent the answers to the question:
Who are you going to vote for in the next elections?
In this graphic, the represented percentage adds up to 100%. It may seem that everyone surveyed already knows who they are
going to vote for and they also agreed to share these decisions with whoever is polling them. This means that no
one said: “no, thanks” or “I do not know who am I going to vote for”, “No candidate has convinced me yet” or “I
haven’t decided yet”. This is not very likely, but this way of representing polls is the most common one.
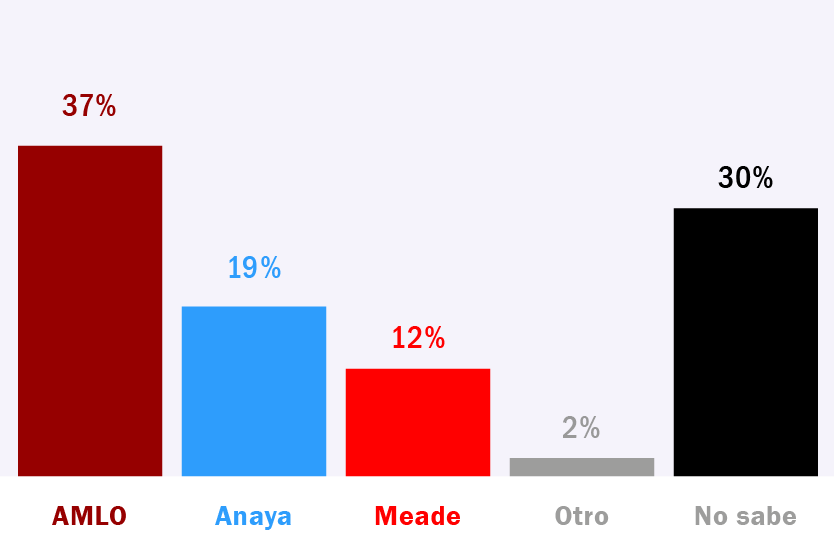
What could happen? Let’s say that in fact 30% of the surveyed subjects did express their uncertainty towards their
vote or refused to respond to that question. The graphic would be (likely) seen as this:
In this graphic, where indecision is represented, things seem less clear. Though the trend is the same as the other graphic,
there is an important percentage of votes to be distributed. We could certainly try to guess the results, but the
truth is that this representation lacks the certainty that the first graphic revealed.
We should not forget the words of Alberto Cairo: “The ethic rules of journalism must also be applied to the information’s
visual representation”.
Trends analysis
Trends analysis tools such as Google Trends (a newer tool than traditional polls) have become a valuable source of
information for politicians, academics, ventures, journalists and governments. Trends (like Social Networks) can
show us structures and connections that are not necessarily between specific people, but between ideas, preferences,
google searches and popular webpages. In other words: they can tell us what are the most searched topics and how
the connections among them as well as how they change through certain periods of time.
Pros:
There are searches not only around the candidates, possibilities and proposals but also on how the system works, how to vote,
why should we vote, institutions, or things that people are not publicly confident about.
The searches that compose the trends are performed by users in spaces of relative privacy and intimacy: people
in front of a computer, phone or tablet. The fact that it is us and our device might imply that we feel it is
safe to search what really interests us, with no fear of exposing our ignorance and/or preferences. These intimate
searches also provide a space where we can question certain assertions made by those that surround us without
necessarily detonating conflicts. In more technical words: concealment of interests is less common.
Certain ideological preferences, like the “hard vote” or postures about drug politics, sexual and reproductive
rights, migration issues, state intervention, etc., are more stable. However, these fixed postures do not necessarily
reflect on a package of opinions/beliefs/preferences that we could infer a priori. In other words, the fact that
someone is going to vote for a specific candidate does not mean that the voter shares and believes in every idea
stated by this politician. People and opinions are complex and they are often ambivalent and contradictory. The
amplitude in scope of trend analysis allows us to encounter contradictions and ambivalences and understand them
as findings in themselves rather than inconsistencies in results.
As in every exploratory method, we need to establish search criteria, ways in which we will collect information
and what we are looking for. Nevertheless, trend analysis is a very cost-effective technique which allows for
trial and error to be less costly than in the case of traditional polls.
The amount of data is immense and is generated with enormous speed which amplifies the possibilities of analysis.
The analysis of trends can reflect other kinds of associations that normal polls ignore such as subject-candidate
relationships, related search terms, etc. What words are more related to which candidate? Who is associated to
words like security, corruption, confidence, intelligence? Which candidates are often compared?
We can perform analysis in real time, without temporal delay which allows for reflection and exposure to certain
events and thus influences preferences and opinions. This approach allows a more direct access to opinions, how
they change and what makes them change. For example: if a candidate talks about a constitutional reform it is
likely that this subject becomes a popular search term on Google. Or if someone adds an “unknown” or “less popular”
member to their staff, his or her name can become a popular Google Search Term.
It is quite possible that there are searches not only around the candidates, possibilities and proposals but also
on how the system works, how to vote, why should we vote, institutions, or things that people are not publicly
confident about. This is not only interesting but useful because it allows us to know about some information
voids, doubts and misperceptions people may have towards the election process.
Cons:
There are many possible biases such as age, access to technologies, knowledge on how to use a search tool and even more basic
stuff such as literacy. Internet access in countries like Mexico is still limited and stratified.
Trends have the advantage of being “more honest”. However, they need some very sophisticated analysis that allow
us to conclude certain things and interpret the results. In other words: the constant search of a certain candidate
does not necessarily reflect preference, it could even imply the opposite.
Google searches do not discriminate between who will vote and who will not: as they don’t show characteristics
of the person performing the search, we cannot know their age, nationality, place of residency, etc.
There are many possible biases such as age, access to technologies, knowledge on how to use a search tool and even
more basic stuff such as literacy. Internet access in countries like Mexico is still limited and stratified in
terms of age, geographic location, socioeconomic status and gender (things that will be discussed in other texts).
Trends analysis can give us comparative information: candidate a vs. candidate b, the frequency related to search
terms, and words related to candidates. But these types of analysis do not show absolute numbers. Google trends
does not give absolute numbers as results, so we can only know the frequency distribution inside a universe of
data whose characteristics are unknown to us. For example: we can know the percentage distribution of searches
but not if they were 1000 searches or a million searches.
The relevance of public opinion does not only rely in its possibility of reflecting preferences but in the fact that
it can also enforce and mold the agenda. To acknowledge this complexity, the existing and emerging associations,
searches and answers does not only help us articulate a diagnosis of the current state of things but may also turn
into a first glimpse into what could become a more effective and close response to peoples’ concerns.
References
Moreno, Alejandro. 2008a. “La Opinión Pública Mexicana En El Contexto Postelectoral de 2006.”
Perfiles Latinoamericanos 16 (31): 39–63.
———. 2008b. “La Opinión Pública Mexicana En El Contexto Postelectoral de 2006.” Perfiles Latinoamericanos 16 (31):
39–63.
Pavía, Jose M., Pau Rausell, Francisco Marco-Serrano, and Vicente Coll. 2011a. “Encuestas Electorates Online: Nuevos
Retos, Viejos Problemas / Online Electoral Polls: New Challenges, Old Problems.” Reis, no. 135: 107–21.
Red Ética FNPI. 2014.
10 principios de Alberto Cairo sobre la ética en la inforgrafía periodística. http://eticasegura.fnpi.org/2014/01/15/10-principios-de-alberto-cairo-sobre-la-etica-en-la-infografia-periodistica/
Willnat, Lars, Ven-hwei Lo, and Annette Aw. 2012. “The Good, the Bad and the Ugly: Public Opinion Polling in Taiwan.”
In
Opinion Polls and the Media, 198–222. Palgrave Macmillan, London.
https://link.springer.com/chapter/10.1057/9780230374959_10.

 In this graphic, the represented percentage adds up to 100%. It may seem that everyone surveyed already knows who they are
going to vote for and they also agreed to share these decisions with whoever is polling them. This means that no
one said: “no, thanks” or “I do not know who am I going to vote for”, “No candidate has convinced me yet” or “I
haven’t decided yet”. This is not very likely, but this way of representing polls is the most common one.
In this graphic, the represented percentage adds up to 100%. It may seem that everyone surveyed already knows who they are
going to vote for and they also agreed to share these decisions with whoever is polling them. This means that no
one said: “no, thanks” or “I do not know who am I going to vote for”, “No candidate has convinced me yet” or “I
haven’t decided yet”. This is not very likely, but this way of representing polls is the most common one.
 In this graphic, where indecision is represented, things seem less clear. Though the trend is the same as the other graphic,
there is an important percentage of votes to be distributed. We could certainly try to guess the results, but the
truth is that this representation lacks the certainty that the first graphic revealed.
In this graphic, where indecision is represented, things seem less clear. Though the trend is the same as the other graphic,
there is an important percentage of votes to be distributed. We could certainly try to guess the results, but the
truth is that this representation lacks the certainty that the first graphic revealed.